SmartBall
Addressing the water loss
What is Smartball?
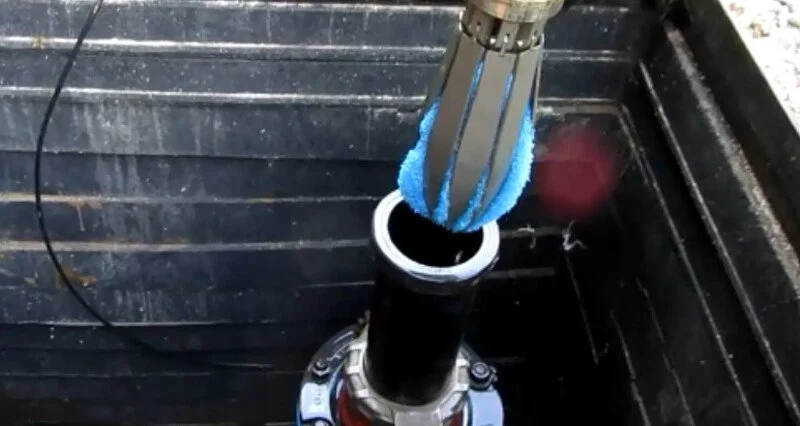
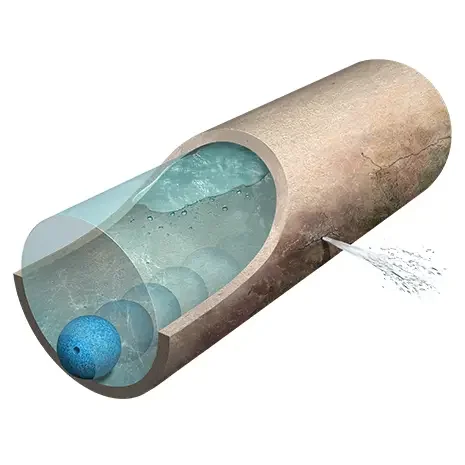
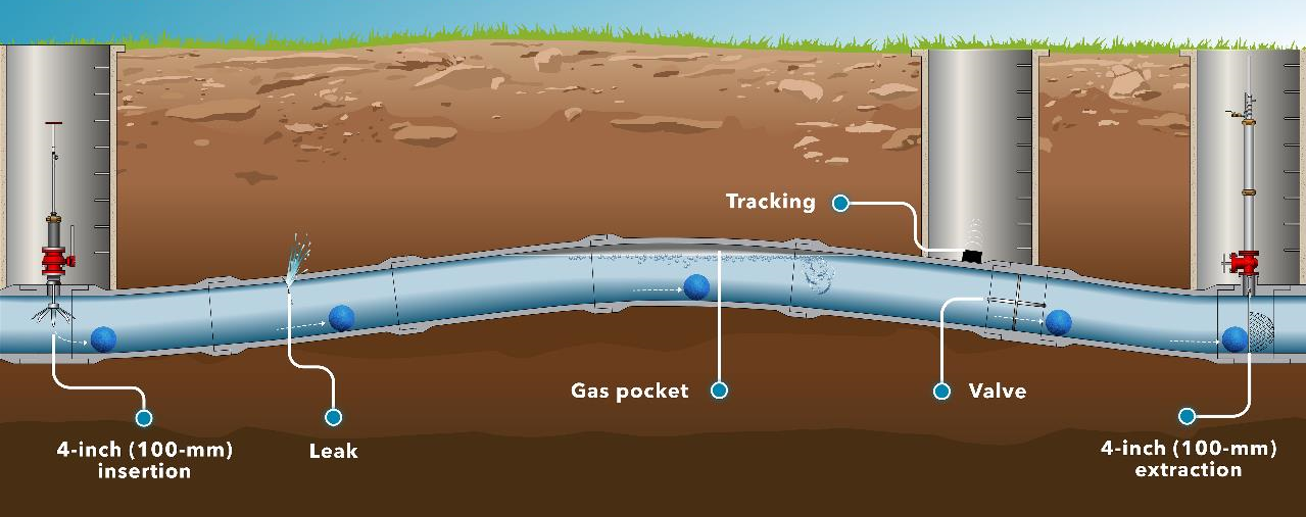
SmartBall® is a powerfull free-swimming, non-intrusive inspection tool that helps utilities detect leaks, gas pockets, and pipeline issues—without disrupting service.
With its advanced acoustic sensor and onboard mapping tools, SmartBall travels through pressurized pipelines to deliver actionable insights for smarter infrastructure decisions. It gives operators clear, accurate data to help plan repairs and extend pipeline life.
How it works?

The challenges
Long-distance and buried pipelines
Aging infrastructure
Increase in population/consumption
Unknown or Unmapped Connections
Improper Pressure Management
Ground Movement or Soil Conditions
Why choose Smartball?
-
High accuracy
Equipped with a sensitive acoustic sensor, the tool is capable of detecting and pinpointing leaks with high degree of accuracy.
The inclusion of a gyroscope, accelerometer, and magnetometer enables to track the pipeline’s path and identification of features like joints and structural changes.

-
No Service Interruption
Provides de ability of performing uninterrupted inspections across long distances, ensuring customer service remains unaffected.
Driven by pipeline flow, it continuously monitors acoustic signals to detect the presence of leaks and gas pockets while the pipe is in normal operation conditions.

-
Prompt results
Once the inspection is complete, the SmartBall’s data is retrieved and run through analytics software allowing to have a preliminary location of the anomalies detected.
Further data refinement is carried out post-inspection to improve the accuracy of anomaly detection.


